Activity #2 – Information as a Graphic
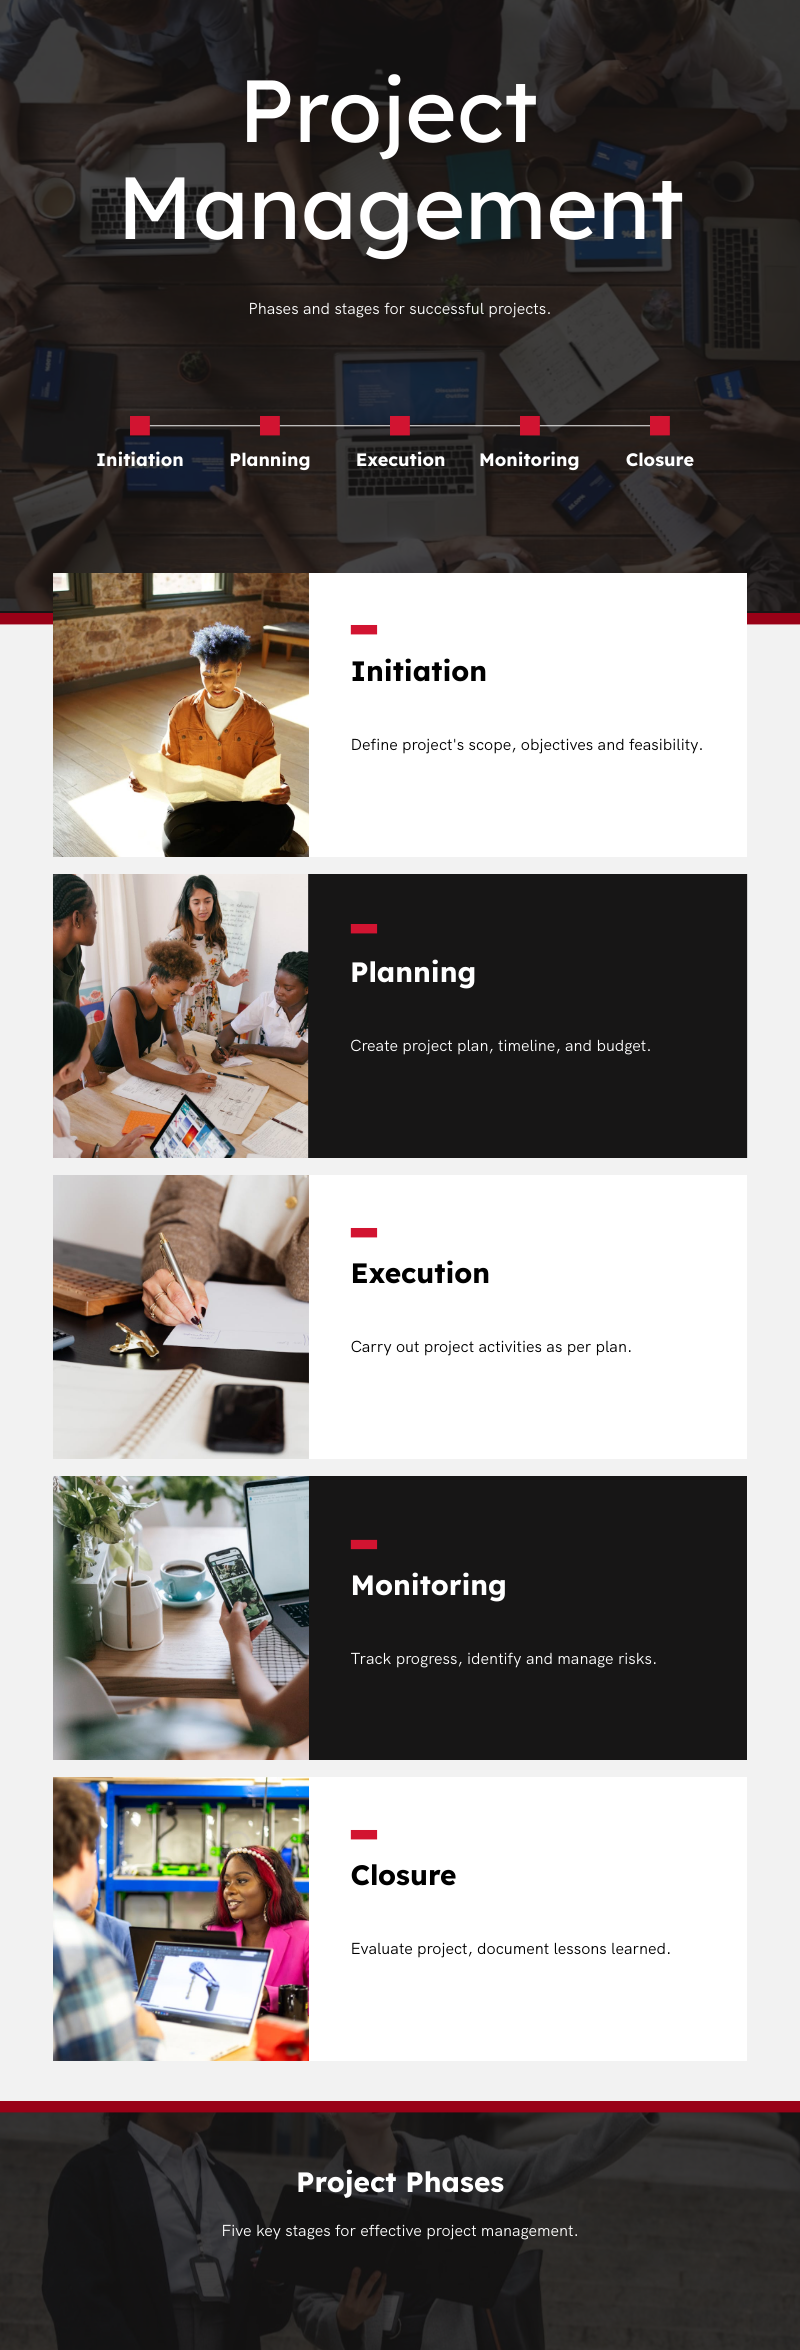
I made an infographic introducing the five stages of project management:
 Tweet
Tweet
Example for "Activity #2 – Information as a Graphic":
https://bank.ecampusontario.ca/wp-content/uploads/2024/05/project-managem_63956802.png