Information as a Graph – Procedure Differences
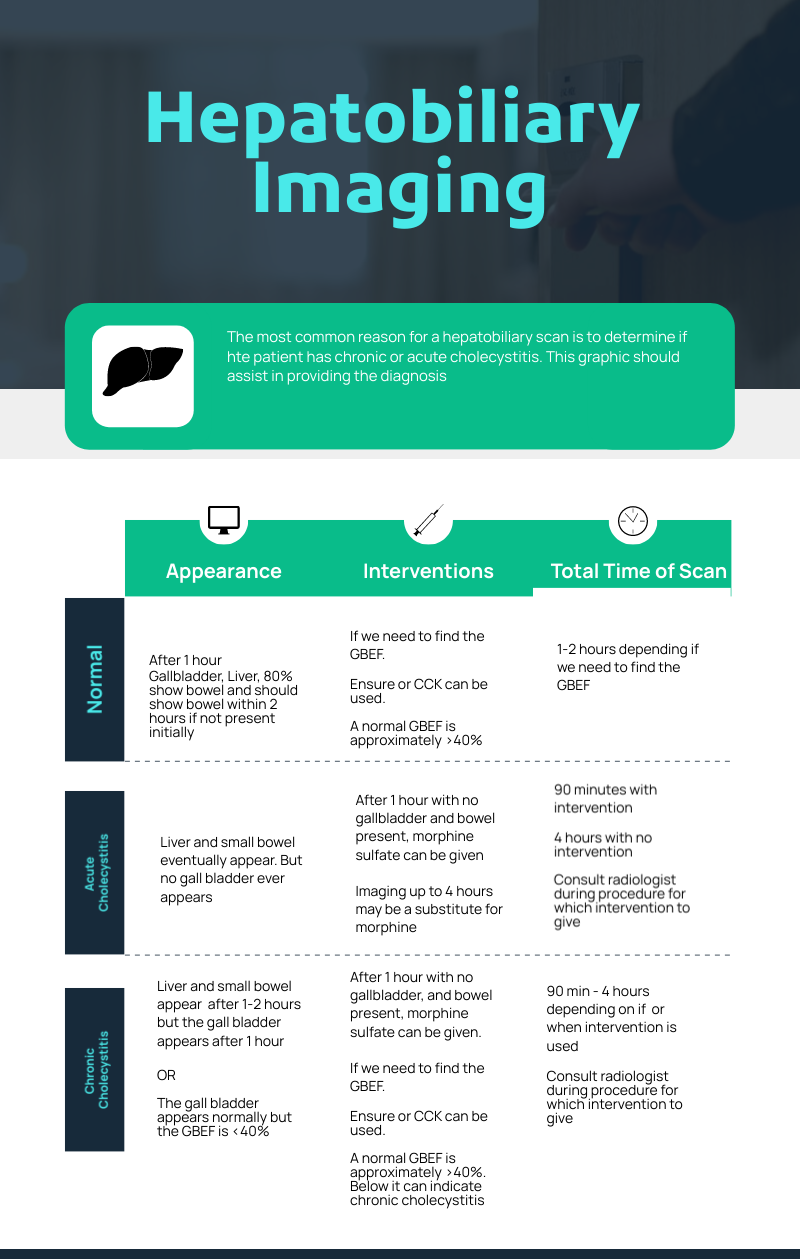
I have made an infographic about contrasting the most common results for a hepatobiliary scan. It can be overwhelming so an graphic may help! See attached.
TweetExample for "Information as a Graph – Procedure Differences":
https://bank.ecampusontario.ca/wp-content/uploads/2024/05/competitor-comp_63946318.png