INFORMATION AS A GRAPHIC
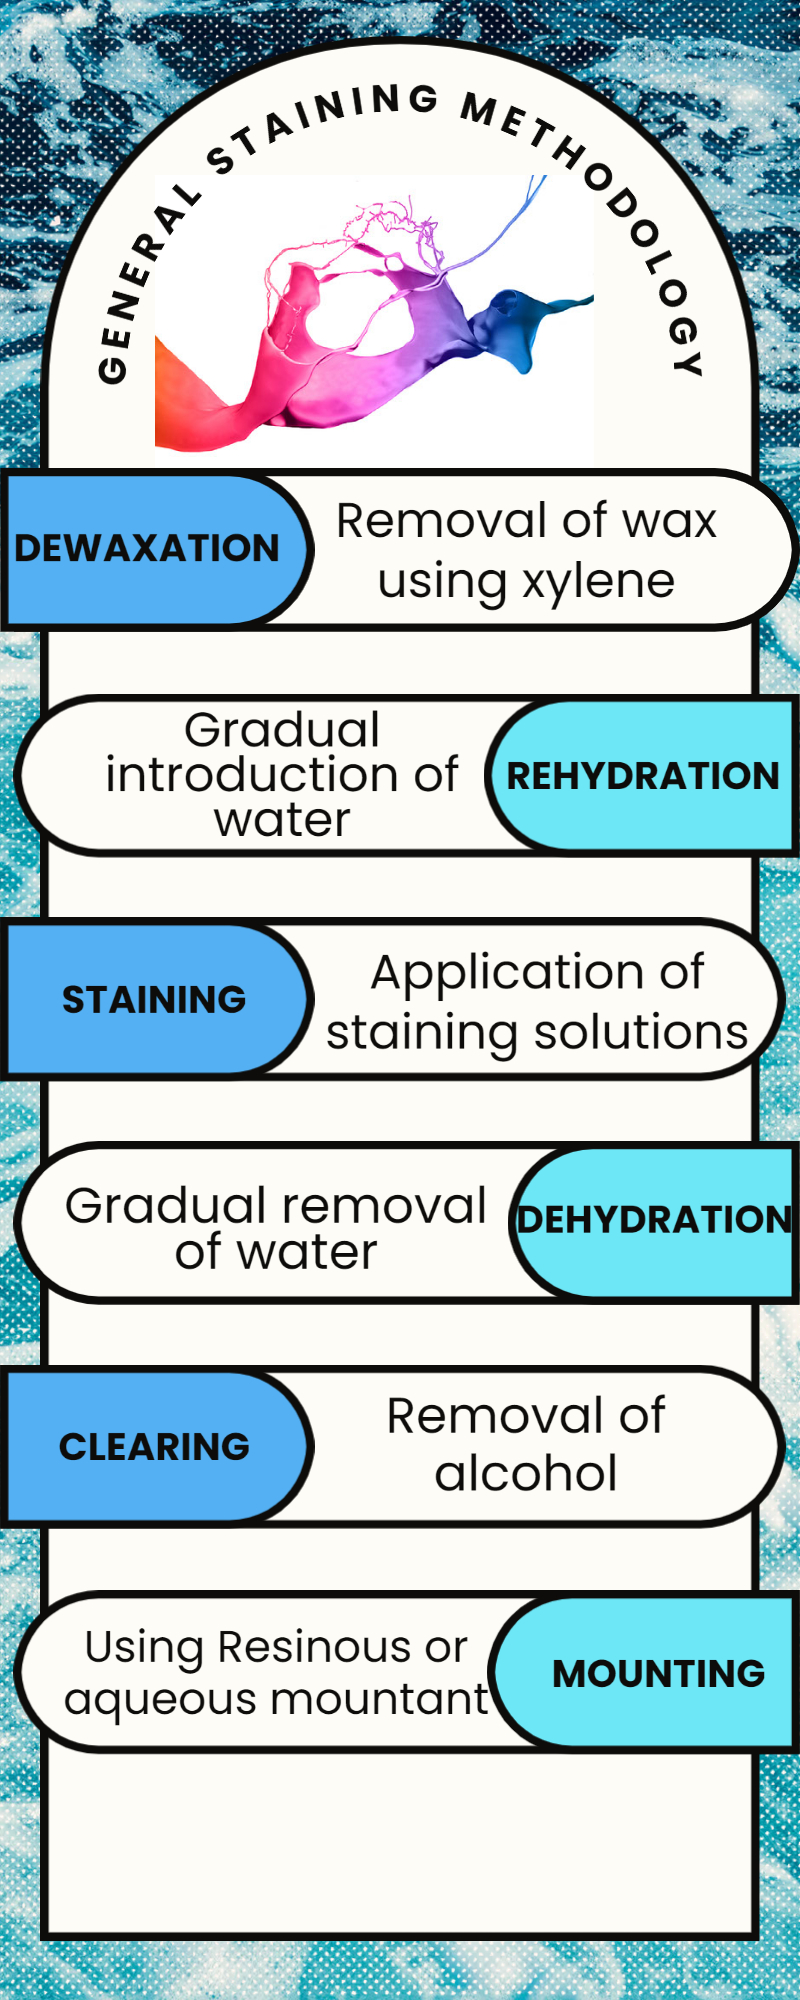
I had a lot of fun learning how to navigate Adobe Sparks and creating an infographic in general staining methodologies. It’s a great way to convey content through visual graphics. I especially like how the displayed information is conveyed quickly and clearly through visual representation. I will definitely be including this creation in my lesson.
TweetExample for "INFORMATION AS A GRAPHIC":
https://bank.ecampusontario.ca/wp-content/uploads/2022/12/INFOGRAPHICS.jpg