Information as a Graphic –> How to? in Raystation
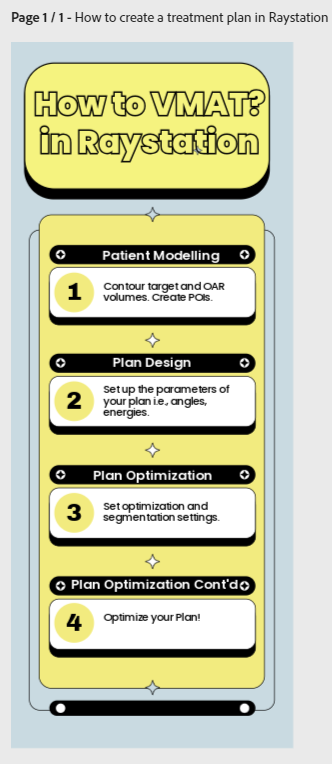
Please find attached an image of the infographic created for my learners regarding utilization of Raystation. It serves as a very brief summary, but effective in showing learners the general gist and uses of different treatment planning environments within Raystation. I will be sure to add this in to my course this upcoming year.
Rahul
TweetExample for "Information as a Graphic –> How to? in Raystation":
https://bank.ecampusontario.ca/wp-content/uploads/2024/05/How-to.png