Information as a Graphic
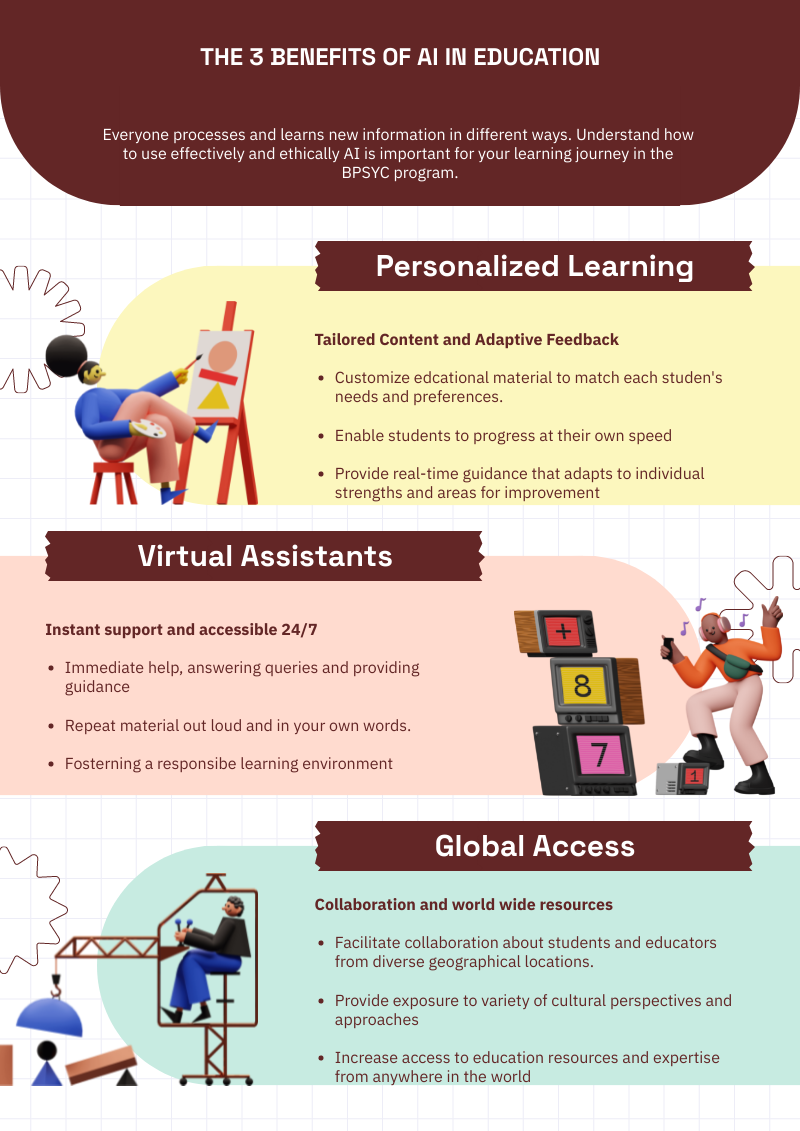
I focused on crafting an infographic to encapsulate three benefits of generative artificial intelligence in education. After trying both Canva and Piktochart, I found Piktochart more conducive and user-friendly for creating infographics. The platform provided accessible templates, streamlining the process of transferring content seamlessly. The resulting infographic visually conveyed pertinent information, serving as a quick reference guide for students.
TweetExample for "Information as a Graphic":
https://bank.ecampusontario.ca/wp-content/uploads/2023/11/Infographic.png

