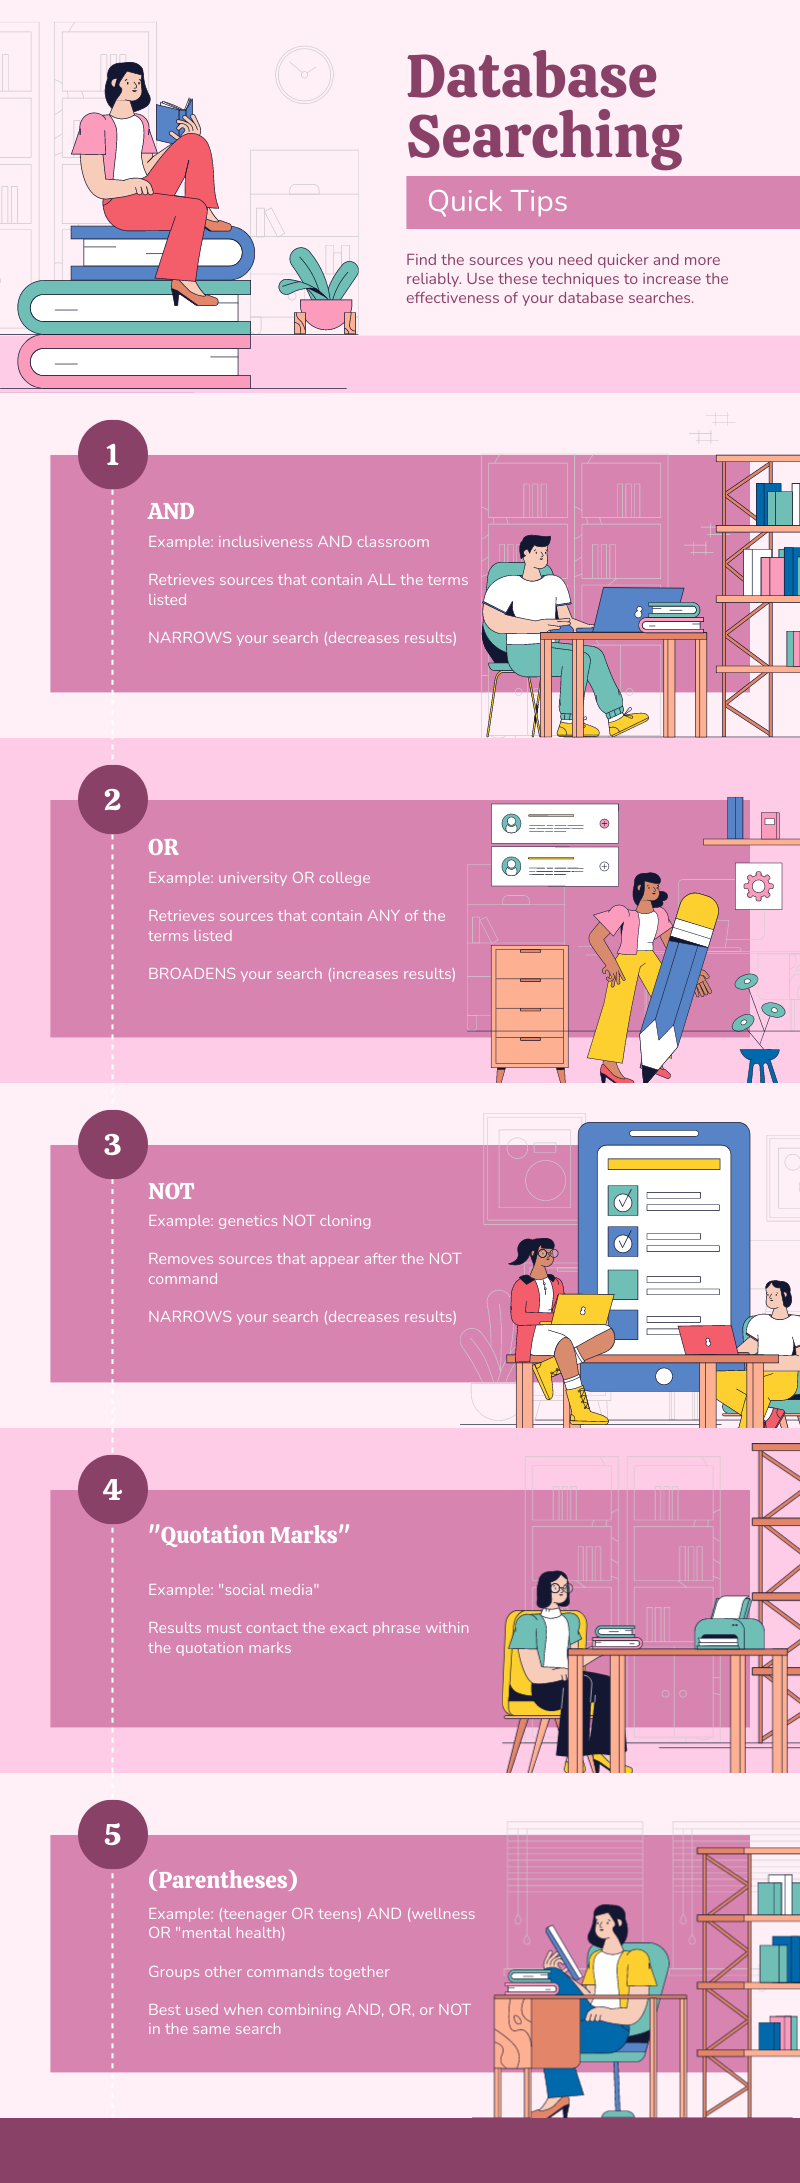
Database Search Commands in Infographic Form
I’ve made a few infographics in the past and the process can be quite time consuming to ensure they are easy to read, visuals and text align, and other best practices. I’ve used a few of the tools listed here before, but hadn’t tried Piktochart yet. I found the templates easy to build off of and for my trial, I decided to make an infographic of some general search commands that can be used in library databases to search more effectively.
If I were to use this in my teaching, I would try to make the graphics align more with the content and also change the colour scheme to our institution’s colours so that it could be shared more easily, but for a first attempt at making a quick infographic, this tool was easy to use and had a similar UI to Canva and other tools I’ve used before.
TweetExample for "Database Search Commands in Infographic Form":
https://bank.ecampusontario.ca/wp-content/uploads/2023/10/Database-Searching-Tips-Infographic.png


Leave a Reply