Infographic – presenting information in a different way
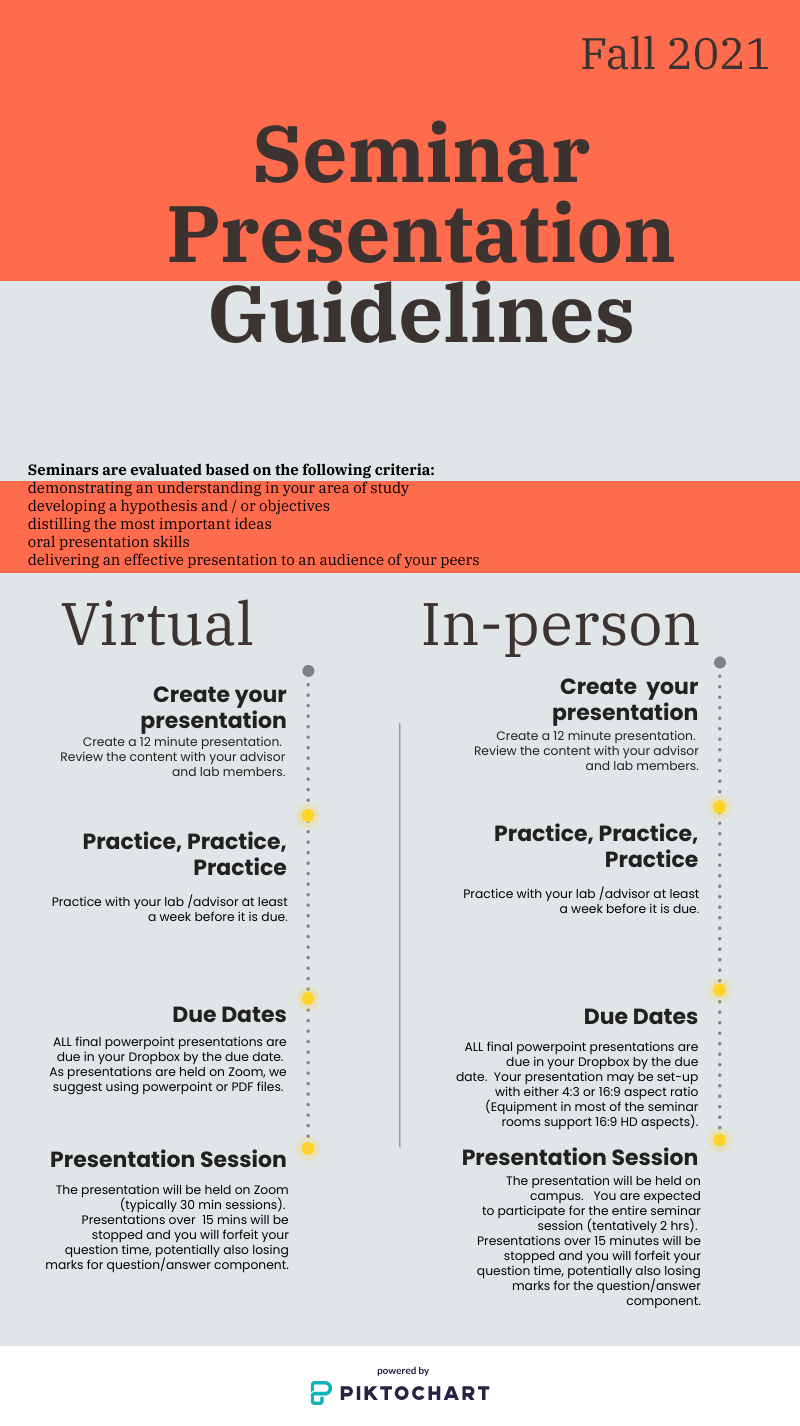
Previously I have used PowerPoint to create infographics. For this activity, I was interested in exploring other tools (Canva and Piktochart) to create infographics. To offer flexibility, in a course I am involved with, we are providing students with the option to present their seminar either virtually or on campus. I created an infographic to outline the key steps involved, with the aim to provide this information early in the semester. I found both Piktochart and Canva were user friendly. Both tools had a number of templates to select to create the infographic. A key positive aspect of presenting information in an infographic is that it is more engaging to our students. It provides a neat and alternative way to present a summary set of instructions.
TweetExample for "Infographic – presenting information in a different way":
https://bank.ecampusontario.ca/wp-content/uploads/2021/07/my-visual_55113799-1.png
Leave a Reply