Infographic
INfographic was chosen to outline the steps in calculating an IV Drop rate. Students get confused so this may help.
TweetINfographic was chosen to outline the steps in calculating an IV Drop rate. Students get confused so this may help.
Tweet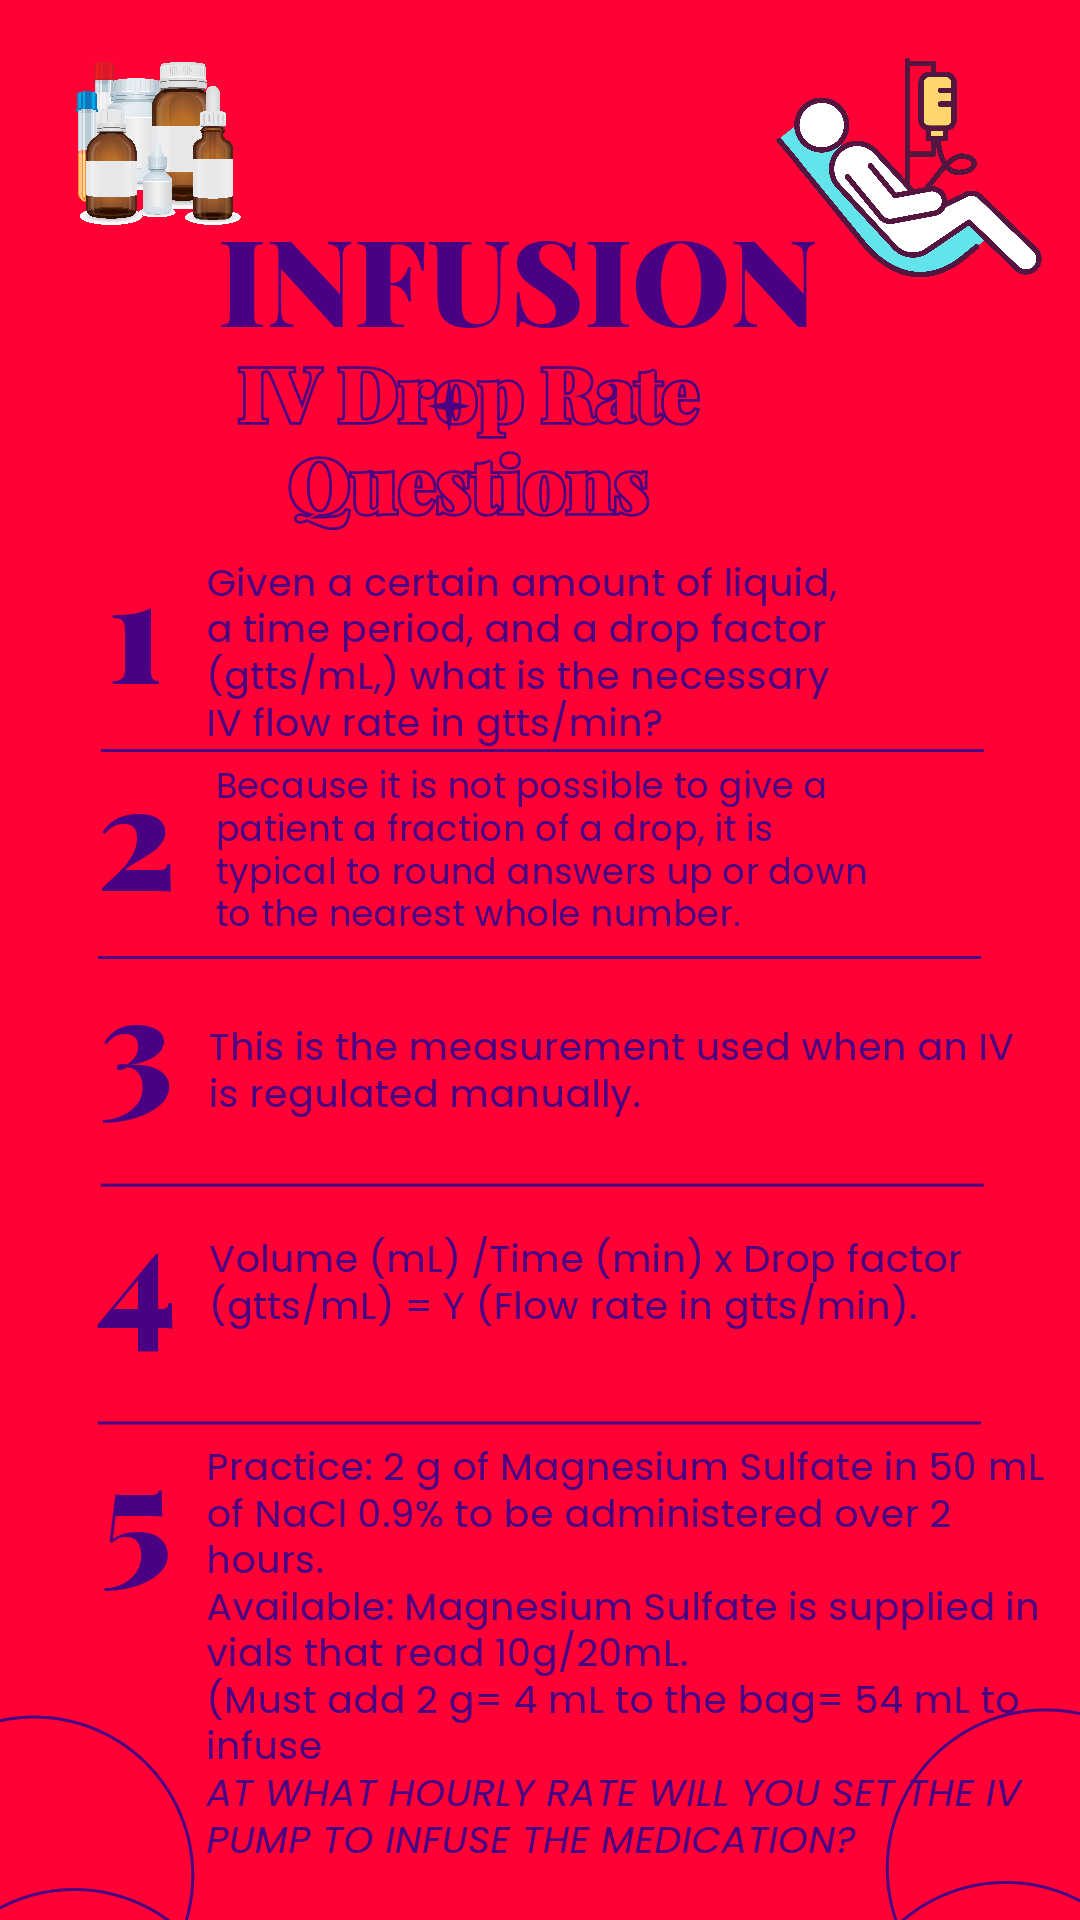
Leave a Reply