Information as a Graphic
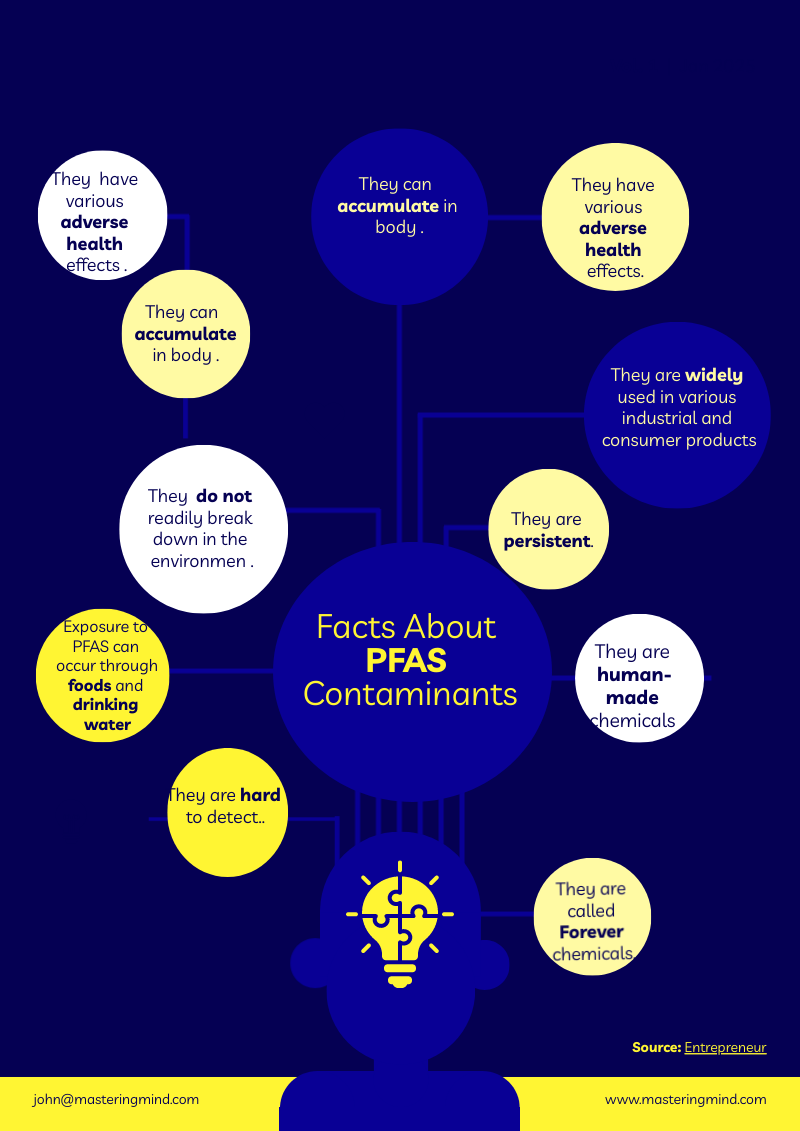
I used “piktochart” to create the infographic on facts about PFAS contaminants.
TweetExample for "Information as a Graphic":
https://bank.ecampusontario.ca/wp-content/uploads/2023/11/activity-3.png
I used “piktochart” to create the infographic on facts about PFAS contaminants.
TweetExample for "Information as a Graphic":
https://bank.ecampusontario.ca/wp-content/uploads/2023/11/activity-3.png
Leave a Reply